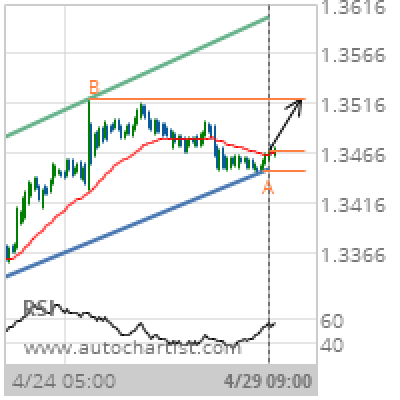
Rising Wedge identified at 29-Apr-2019 11:00 UTC. This pattern is still in the process of forming. Possible bearish price movement towards the support 2919.2500 within the next 2 days.
E-mini S&P 500 JUNE 2019 Target Level: 2919.2500
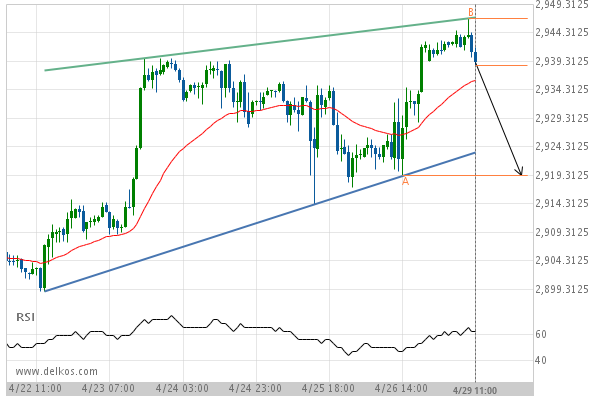

Rising Wedge identified at 29-Apr-2019 11:00 UTC. This pattern is still in the process of forming. Possible bearish price movement towards the support 2919.2500 within the next 2 days.