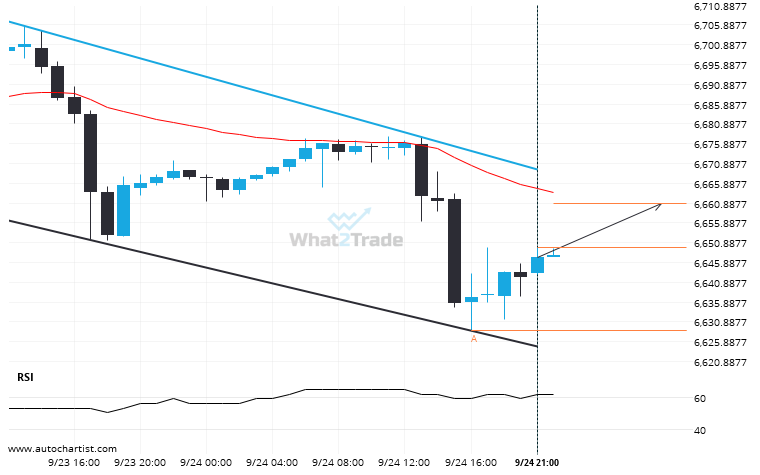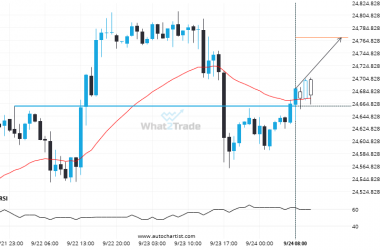
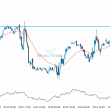
US 500 is trapped in a Flag formation, implying that a breakout is Imminent. This is a great trade-setup for both trend and swing traders. It is now approaching a support line that has been tested in the past. Divergence opportunists may be very optimistic about a possible breakout and this may be the start of a new trend. It may also be that this convergence factor may result in the ideal setup for swing traders that are on the lookout for a possible bounce-back. Whatever happens, an initial move towards 6660.7543 is expected in the short term.
Because US 500 formed a Flag pattern, we expect it to touch the resistance line. If it breaks through resistance it may move much higher