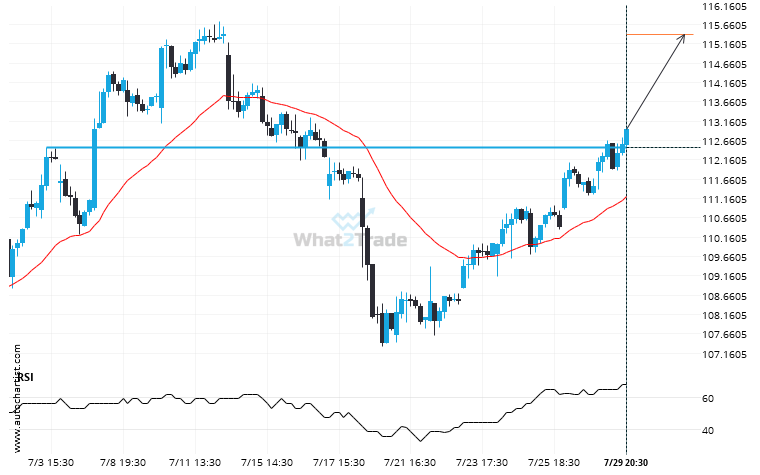
XOM has broken through a resistance line. It has touched this line numerous times in the last 27 days. This breakout shows a potential move to 115.4105 within the next 2 days. Because we have seen it retrace from this level in the past, one should wait for confirmation of the breakout.
Related Posts
CVX is signaling a possible trend reversal on the intraday charts with price not breaching resistance.
CVX is heading towards the support line of a Rising Wedge. If this movement continues, the price of…
If MSFT touches 514.9850 it may be time to take action.
MSFT is moving towards a resistance line. Because we have seen it retrace from this level in the…
INTC hits 20.4100 after a run of 6 consecutive 4 hour candles spanning 6 days.
Due to the rate of consecutive bearish candles on INTC 4 hour chart we could be in for…