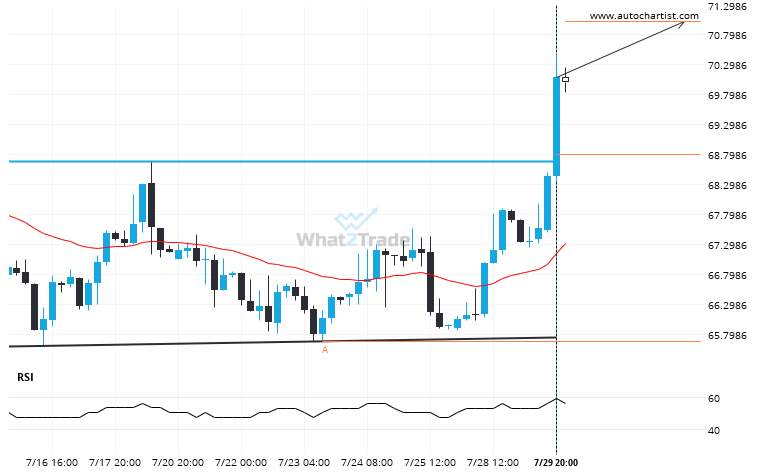
US Oil moved through the resistance line of a Double Bottom at 68.8060322580645 on the 4 hour chart. This line has been tested a number of times in the past and this breakout could mean an upcoming change from the current trend. It may continue in its current direction toward 71.0274.
Related Posts
US Oil breakout from a Rising Wedge trade setup. Will it continue this trend to hit the target price?
US Oil has broken through the support line which it has tested twice in the past. We have…
Gold Spot formed a Channel Up on the 30 Minutes chart. Retest of resistance in sight.
Emerging Channel Up detected on Gold Spot – the pattern is an emerging one and has not yet…
If you’re short Natural Gas you should be aware of the rapidly approaching level of 3.1500
A strong resistance level has been identified at 3.1500 on the 15 Minutes Natural Gas chart. Natural Gas…