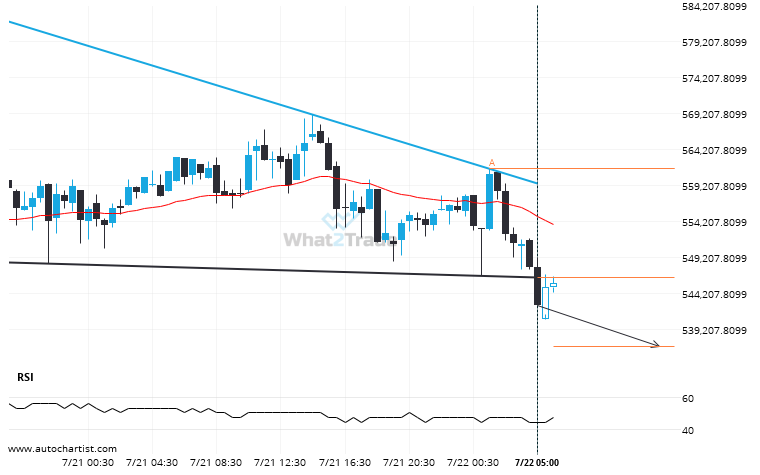
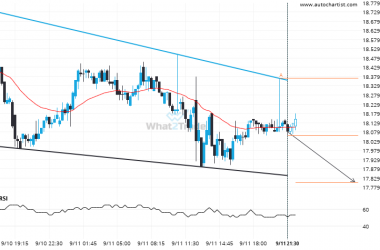
The last 2 30 Minutes candles on ETHJPY formed a Descending Triangle pattern and broken out through the pattern lines, indicating a possible bearish movement towards the price level of 536851.2654.
Related Posts
Rare set of bullish consecutive candles on the ETHBTC Daily chart. Can we expect a turn-around?
ETHBTC has experienced an unusual quantity of bullish candles on the Daily timeframe. This is in the 0.95…
BTCAUD seems to be on its way to support – a possible opportunity?
BTCAUD is heading towards a line of 177007.1719. If this movement continues, the price of BTCAUD could test…
LTCBTC moves higher to 9.9420E-04 in the last 9 days.
Rare set of consecutive candles on the LTCBTC Daily chart. Could we expect a turn around from 9.9420E-04…