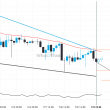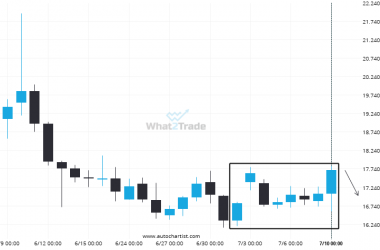
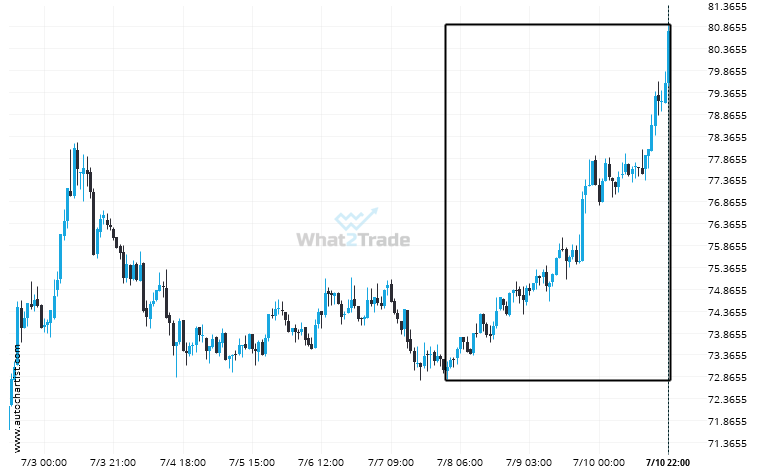
An unexpected large move has occurred on LTCEUR 1 hour chart beginning at 73.08 and ending at 80.75. Is this a sign of something new? What can we expect in the future?
LTCEUR moves higher to 80.75 in the last 3 days.

An unexpected large move has occurred on LTCEUR 1 hour chart beginning at 73.08 and ending at 80.75. Is this a sign of something new? What can we expect in the future?