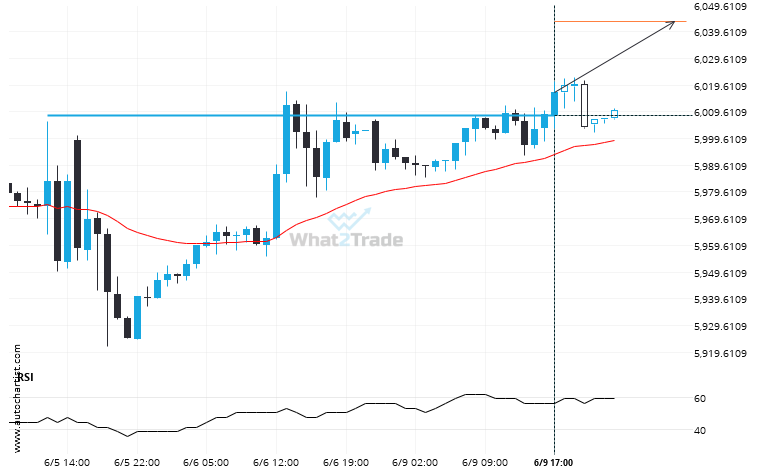
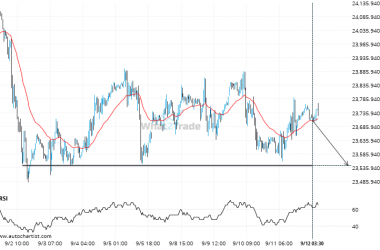
US 500 has broken through 6008.0898 which it has tested numerous times in the past. We have seen it retrace from this price in the past. If this new trend persists, US 500 may be heading towards 6043.5171 within the next 6 hours.
Related Posts
Because CAC 40 formed a Triangle pattern, we expect it to touch the resistance line. If it breaks through resistance it may move much higher
CAC 40 is approaching the resistance line of a Triangle. It has touched this line numerous times in…
Is the extremely large movement on FTSE 100 a sign of things to come?
Those of you that are trend followers are probably eagerly watching FTSE 100 to see if its latest…
DOW 30 – approaching a support line that has been previously tested at least twice in the past
A Channel Up pattern was identified on DOW 30 at 42696.4, creating an expectation that it may move…