Receive the latest alerts via email

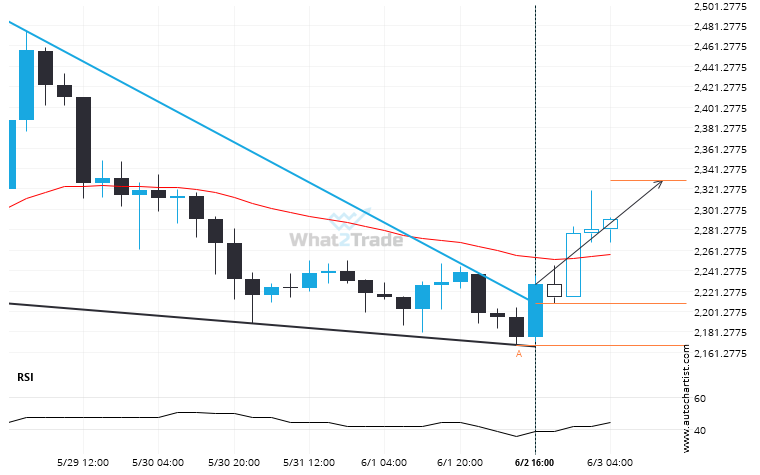
A possible move by ETHEUR towards 2329.6362

ETHEUR moved through the resistance line of a Falling Wedge at 2208.9225 on the 4 hour chart. This line has been tested a number of times in the past and this breakout could mean an upcoming change from the current trend. It may continue in its current direction toward 2329.6362.
Total
0
Shares
Previous Post

An unexpected large move has occurred on FTSE 100 Daily chart! Is this a sign of something new? What can we expect?

Next Post

We expect a $150 movement on EURUSD within 2 hours following the release of Inflation Rate YoY Flash.

Related Posts