Receive the latest alerts via email

After experiencing a 27.09% bullish move in the space of 23 days, nobody knows where NVDA is headed.

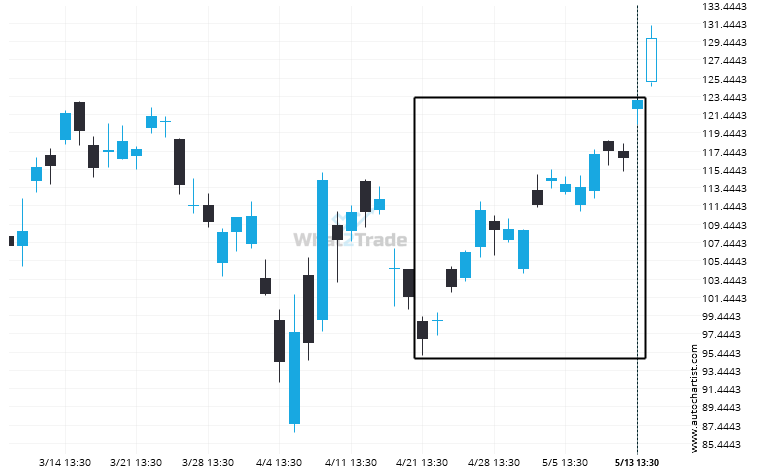
NVDA rose sharply for 22 days – which is an excessively big movement for this instrument; exceeding the 98% of past price moves. Even if this move is a sign of a new trend in NVDA there is a chance that we will witness a correction, no matter how brief.

Total
0
Shares
Previous Post

ASX 200 broke through a support at 2025-05-14T18:00:00.000Z, with the price momentum continuing to move in an downward direction over the next hours, good opportunity presents itself with the price expected to reach 8153.5369.

Next Post

Supports and resistances are primary concepts of technical analysis. Brent Crude is heading for an important price of 64.8040 – read about what this could mean for the future.

Related Posts