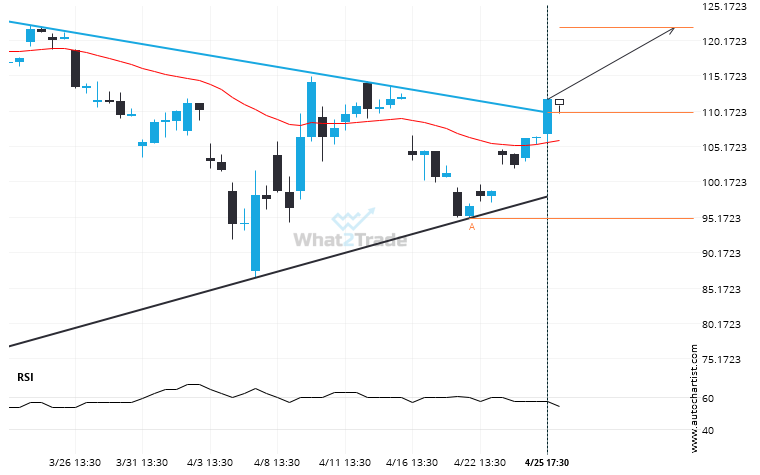
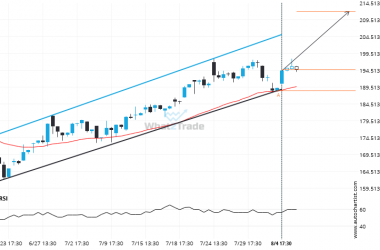
NVDA moved through the resistance line of a Triangle at 110.01310344827588 on the 4 hour chart. This line has been tested a number of times in the past and this breakout could mean an upcoming change from the current trend. It may continue in its current direction toward 122.0188.
Related Posts
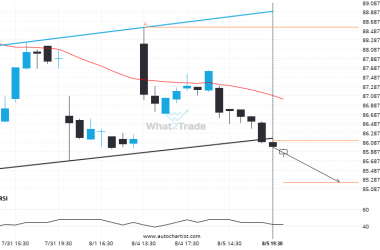
A possible move by BIDU towards 85.2221
This trade setup on BIDU is formed by a period of consolidation; a period in which the price…
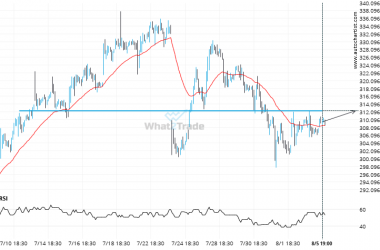
Supports and resistances are primary concepts of technical analysis. TSLA is heading for an important price of 312.3400 – read about what this could mean for the future.
The price of TSLA in heading back to the resistance area. It is possible that it will struggle…
A Channel Up has formed, GOOGL is approaching support. Can we expect a breakout and the start of a new trend or a reversal?
The movement of GOOGL towards the resistance line of a Channel Up is yet another test of the…

