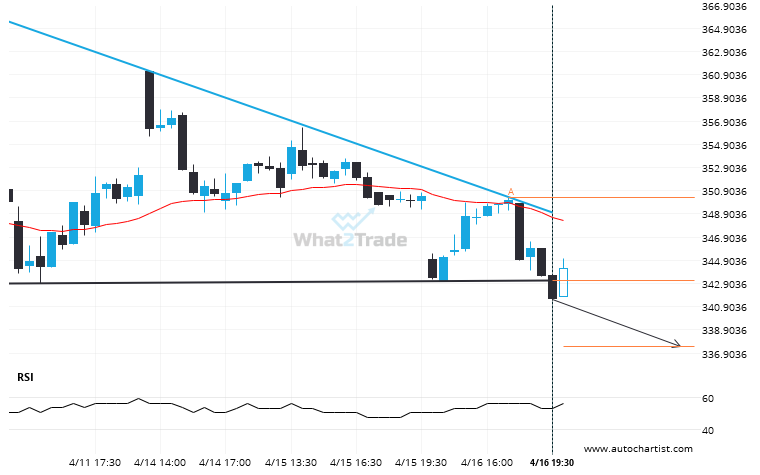
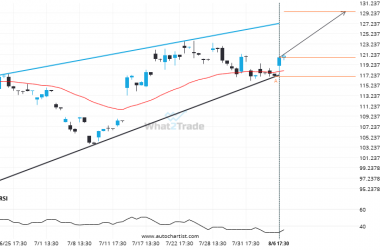
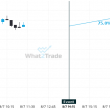
ADBE moved through the support line of a Descending Triangle at 343.1272972972973 on the 30 Minutes chart. This line has been tested a number of times in the past and this breakout could mean an upcoming change from the current trend. It may continue in its current direction toward 337.4472.
Related Posts
After experiencing 5 consecutive 4 hour bullish candles in the space of 5 days, nobody knows where AVGO is headed.
AVGO has experienced an unusual quantity of bullish candles on the 4 hour timeframe. This is in the…
It’s time to make a decision on BRK.B – its recent breach of 500.4800 could be a sign of a new trend to follow.
BRK.B has broken through a support line. Because we have seen it retrace from this price in the…
XOM – approaching a support line that has been previously tested at least twice in the past
XOM is approaching the support line of a Channel Down. It has touched this line numerous times in…