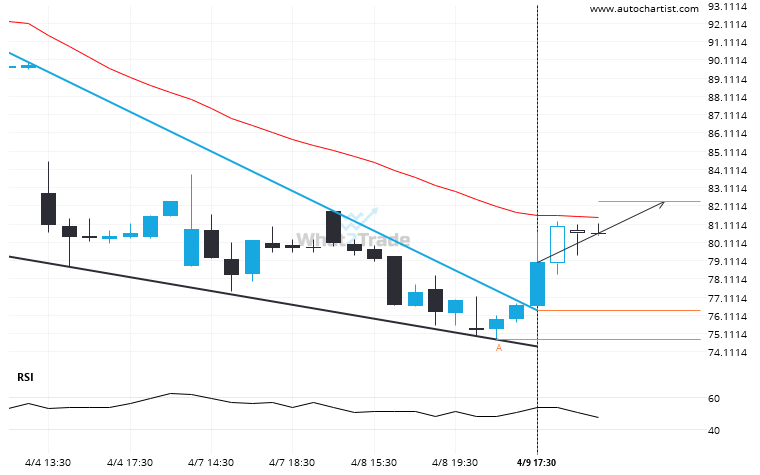
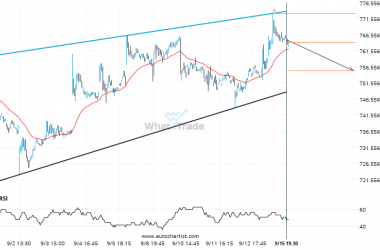
BIDU moved through the resistance line of a Falling Wedge at 76.3833333333333 on the 1 hour chart. This line has been tested a number of times in the past and this breakout could mean an upcoming change from the current trend. It may continue in its current direction toward 82.3657.
Related Posts
Will PFE break through the support level it tested before?
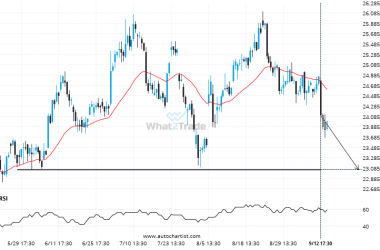
PFE is heading towards 23.0550 and could reach this point within the next 3 days. It has tested…
Big bullish swing on GOOGL – this may be one of its more notable movements in the recent session.
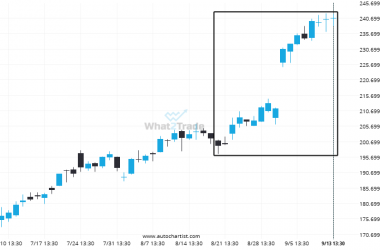
A movement of 20.79% over 25 days on GOOGL doesn’t go unnoticed. You may start considering where it’s…
META – approaching a support line that has been previously tested at least twice in the past
Emerging Rising Wedge detected on META – the pattern is an emerging one and has not yet broken…

