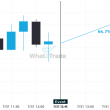
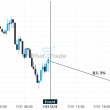
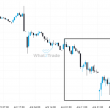
TSLA has broken through a support line of a Triangle chart pattern. If this breakout holds true, we may see the price of TSLA testing 217.4938 within the next 2 days. But don’t be so quick to trade, it has tested this line in the past, so you should confirm the breakout before taking any action.
Related Posts
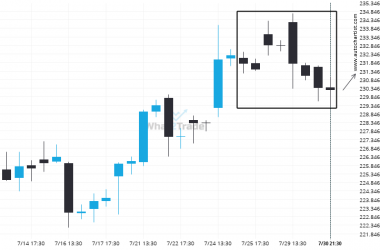
Rare set of bearish consecutive candles on the AMZN 4 hour chart. Can we expect a turn-around?
For those of you that don’t believe in trends, this may be an opportunity to take advantage of…
CVX is signaling a possible trend reversal on the intraday charts with price not breaching resistance.
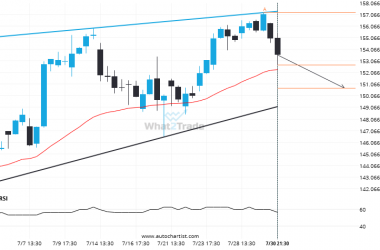
CVX is heading towards the support line of a Rising Wedge. If this movement continues, the price of…
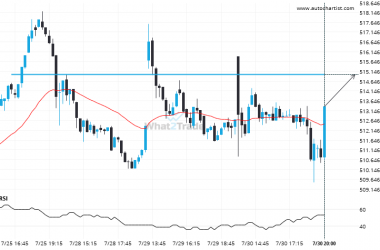
If MSFT touches 514.9850 it may be time to take action.
MSFT is moving towards a resistance line. Because we have seen it retrace from this level in the…

