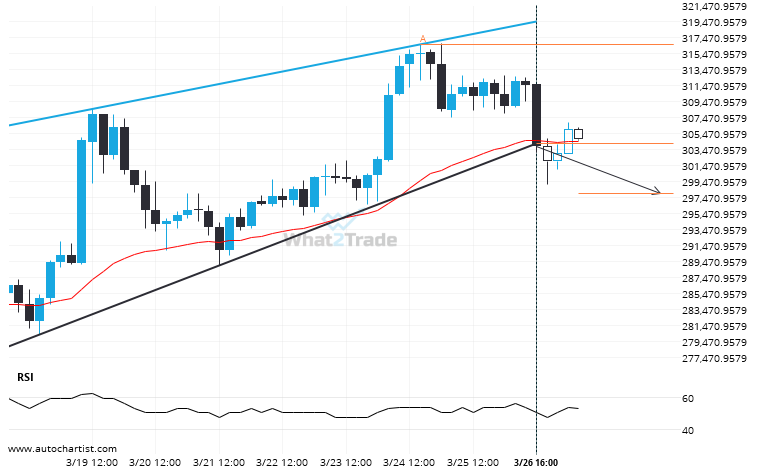
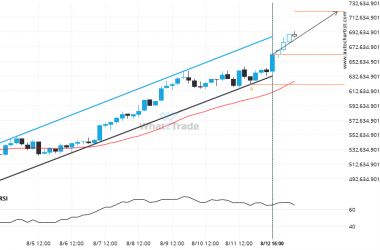
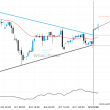
ETHJPY moved through the support line of a Rising Wedge at 304150.9405882352 on the 4 hour chart. This line has been tested a number of times in the past and this breakout could mean an upcoming change from the current trend. It may continue in its current direction toward 297911.0911.
Related Posts
DASHBTC breakout from a Inverse Head and Shoulders trade setup. Will it continue this trend to hit the target price?
The breakout of DASHBTC through the resistance line of a Inverse Head and Shoulders could be a sign…
Important price line being approached by BTCEUR. This price has been tested numerous times before.
A strong resistance level has been identified at 77725.7031 on the 15 Minutes BTCEUR chart. BTCEUR is likely…
XRPUSD is approaching a support line of a Falling Wedge. It has touched this line numerous times in the last 7 days.
XRPUSD is heading towards the support line of a Falling Wedge. If this movement continues, the price of…