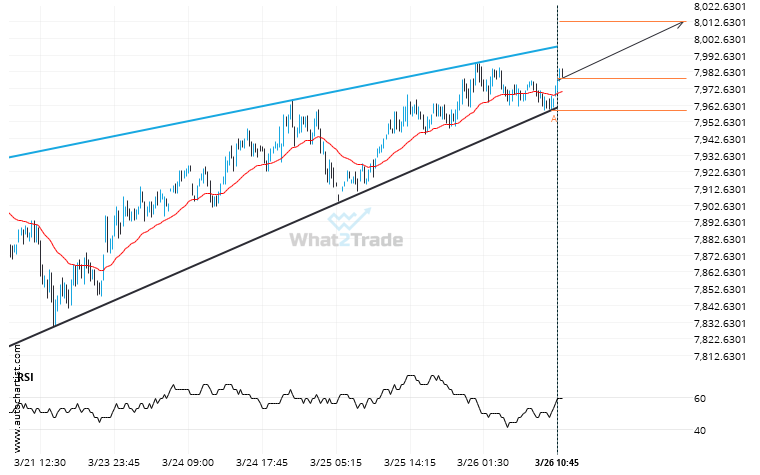
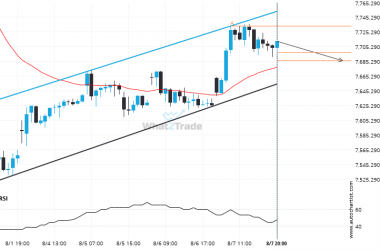
Emerging Rising Wedge pattern in its final wave was identified on the ASX 200 15 Minutes chart. After a strong bullish run, we find ASX 200 heading towards the upper triangle line with a possible resistance at 8012.8774. If the resistance shows to hold, the Rising Wedge pattern suggests a rebound back towards current levels.
Related Posts
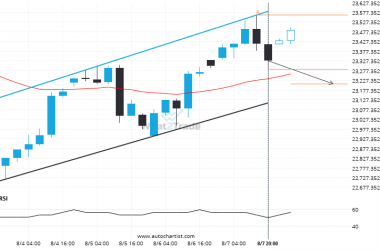
NAS 100 formed a Flag on the 4 hour chart. Retest of support in sight.
NAS 100 is heading towards the support line of a Flag and could reach this point within the…
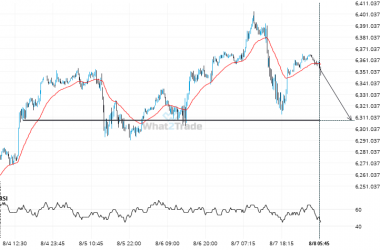
US 500 likely to test 6308.3198 in the near future. Where to next?
US 500 is en route to a very important line that will be a definite deciding factor of…
CAC 40 formed a Channel Up on the 1 hour chart. Retest of support in sight.
The movement of CAC 40 towards the support line of a Channel Up is yet another test of…

