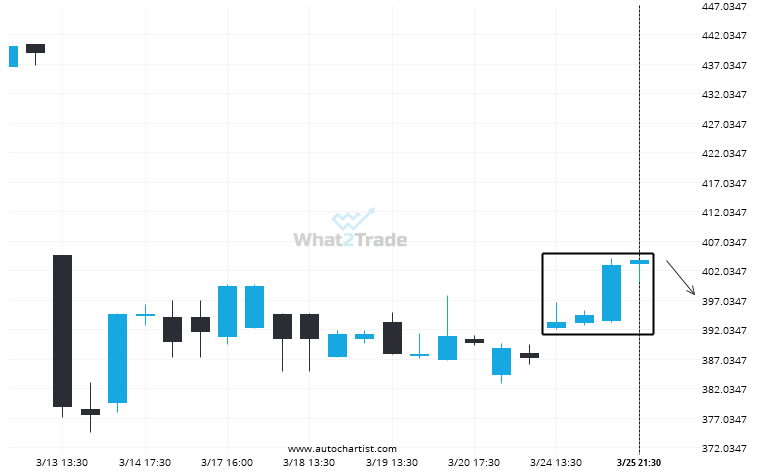
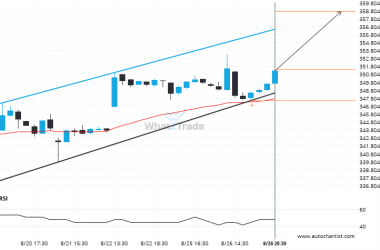
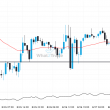
Due to the rate of consecutive bullish candles on ADBE 4 hour chart we could be in for a price correction. If not, this trend could be a sign of things to come
Related Posts
Extreme movement experienced on NKE. Check this chart to see what to do next
NKE has moved lower by 22.03% from 81.19 to 63.3 in the last 31 days.
AVGO experienced 5 consecutive daily bearish candles to reach a price of 169.0800
For those of you that don’t believe in trends, this may be an opportunity to take advantage of…
INTC formed a Falling Wedge on the 15 Minutes chart. Retest of resistance in sight.
INTC is moving towards a resistance line. Because we have seen it retrace from this line before, we…