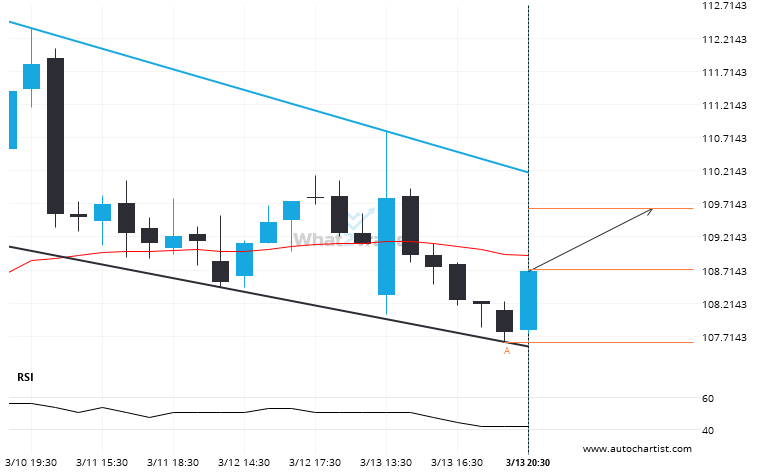
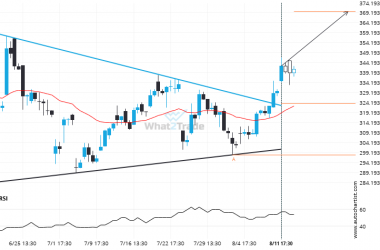
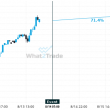
Emerging Flag pattern in its final wave was identified on the XOM 1 hour chart. After a strong bullish run, we find XOM heading towards the upper triangle line with a possible resistance at 109.6438. If the resistance shows to hold, the Flag pattern suggests a rebound back towards current levels.
Related Posts
Important price line being approached by GOOGL. This price has been tested numerous times before.
A strong resistance level has been identified at 161.7200 on the 15 Minutes GOOGL chart. GOOGL is likely…
BRK.B is signaling a possible trend reversal on the intraday charts with price not breaching support.
BRK.B is heading towards the resistance line of a Channel Up. If this movement continues, the price of…
After trying numerous times in the past, NVDA finally breaks 115.3900!
NVDA is once again retesting a key horizontal resistance level at 115.3900. It has tested this level 3…