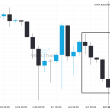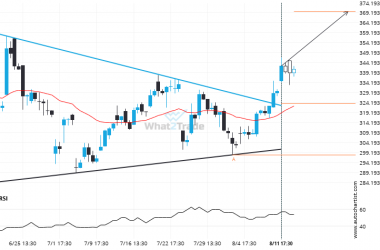
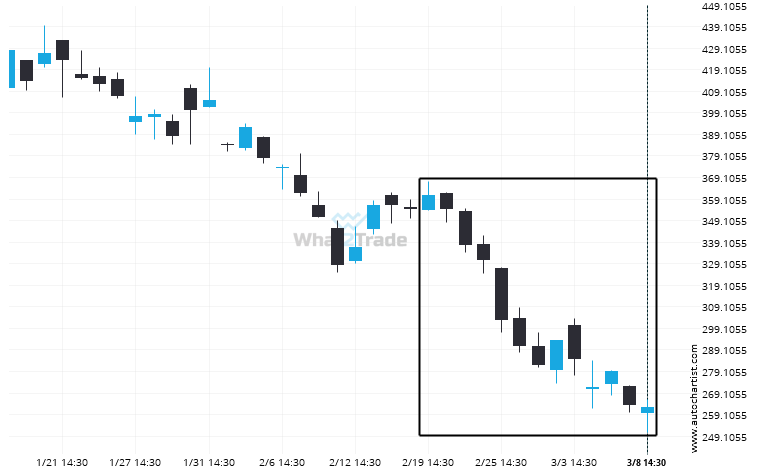
TSLA has moved lower by 27.16% from 360.54 to 262.61 in the last 18 days.
An unexpected large move has occurred on TSLA Daily chart! Is this a sign of something new? What can we expect?

TSLA has moved lower by 27.16% from 360.54 to 262.61 in the last 18 days.