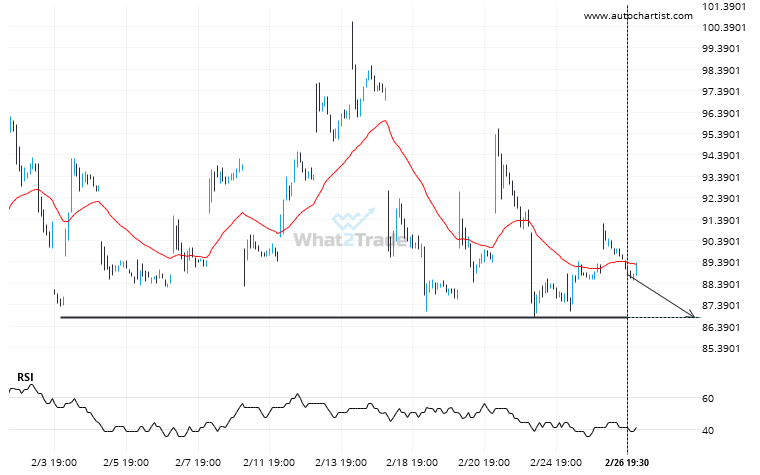
BIDU is heading towards 86.8100 and could reach this point within the next 2 days. It has tested this line numerous times in the past, and this time could be no different, ending in a rebound instead of a breakout. If the breakout doesn’t happen, we could see a retracement back down to current levels.
Related Posts
Rare set of bearish consecutive candles on the AMD Daily chart. Can we expect a turn-around?
Trend followers are probably eagerly watching AMD to see if its latest 4 consecutive candles continues. If not,…
Extreme movement experienced on GOOGL. Check this chart to see what to do next
Those of you that are trend followers are probably eagerly watching GOOGL to see if its latest 13.06%…
TSLA is signaling a possible trend reversal on the intraday charts with price not breaching resistance.
A Channel Down pattern was identified on TSLA at 298.79, creating an expectation that it may move to…