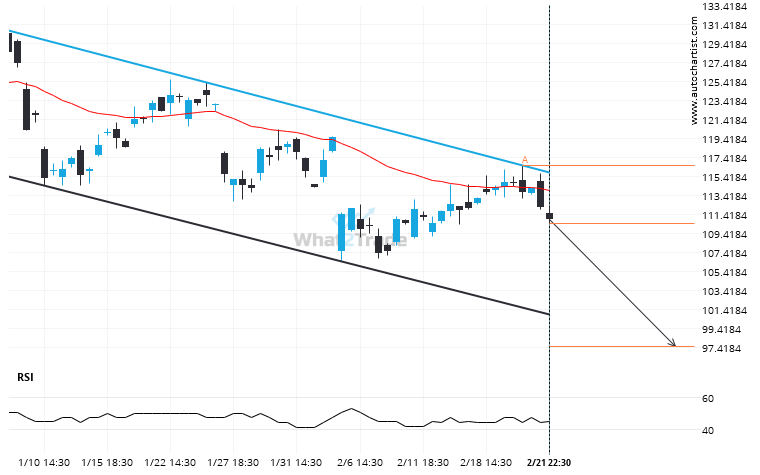
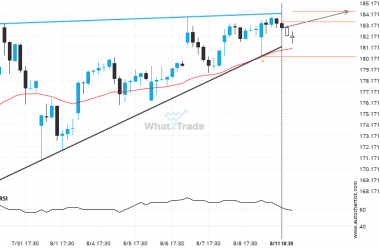
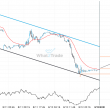
Emerging Channel Down detected on AMD – the pattern is an emerging one and has not yet broken through resistance, but the price is expected to move up over the next few hours. The price at the time the pattern was found was 110.43 and it is expected to move to 97.5415.
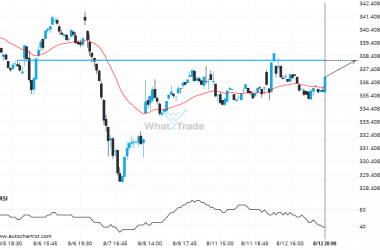
Related Posts
TSLA through 323.62452380952374. Is this a confirming a breakout? Will it continue its path in the current trend toward 369.9006?
TSLA has broken through the resistance line of a Triangle technical chart pattern. Because we have seen it…
V is approaching 338.0450. We expect either a breakout through this line, or a rebound.
V is approaching a resistance line at 338.0450. If it hits the resistance line, it may break through…
NVDA – approaching a resistance line that has been previously tested at least twice in the past
NVDA was identified at around 183.45 having recently rebounded of the support on the 1 hour data interval.…