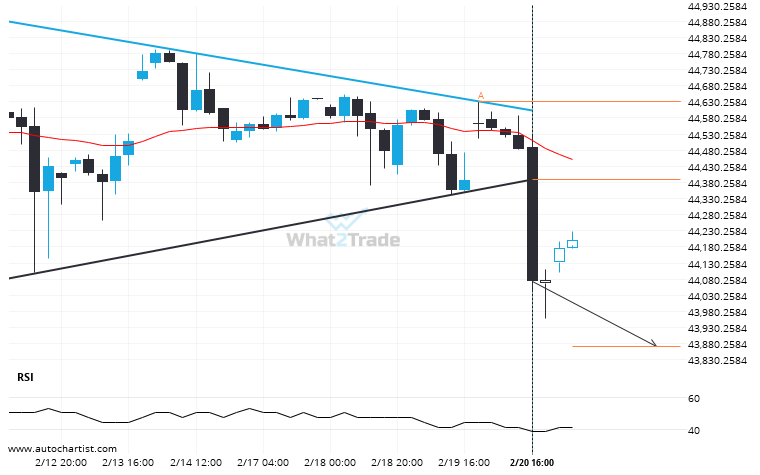
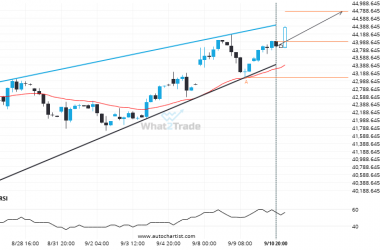
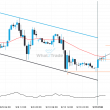
The last 11 4 hour candles on DOW 30 formed a Triangle pattern and broken out through the pattern lines, indicating a possible bearish movement towards the price level of 43870.8429.
Related Posts
After testing 8798.8496 numerous times, FTSE 100 has finally broken through. Can we expect a bullish trend to follow?
FTSE 100 has breached the resistance line at 8798.8496. It may continue the bullish trend towards 8867.8564, or,…
DOW 30 breakout from a Channel Up trade setup. Will it continue this trend to hit the target price?
DOW 30 has broken through the support line of a Channel Up technical chart pattern. Because we have…
Nikkei 225 has broken through a level it has tested 3 times in the recent past.
The price of Nikkei 225 in heading in the direction of 37957.6992. Despite the recent breakout through 37781.0000…