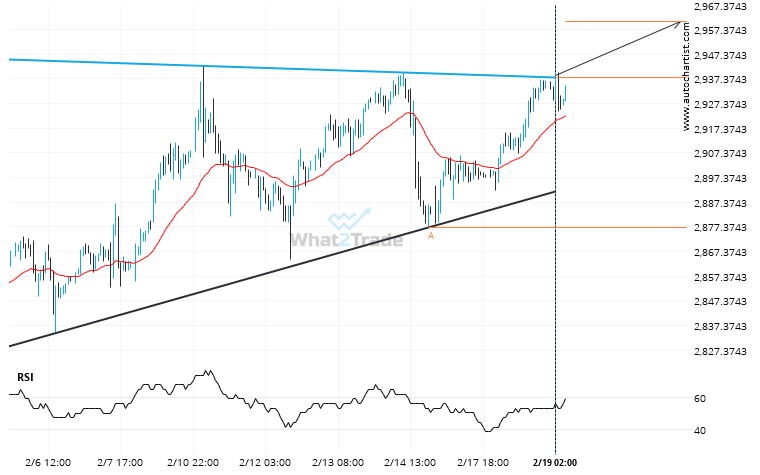
Gold Spot moved through the resistance line of a Ascending Triangle at 2938.054125 on the 1 hour chart. This line has been tested a number of times in the past and this breakout could mean an upcoming change from the current trend. It may continue in its current direction toward 2960.7719.
Related Posts
If you’re long US Oil you should be aware that 62.9405 has just been breached – a level tested 3 time in the past
US Oil has broken through a line of 62.9405 and suggests a possible movement to 62.3590 within the…
Bulls aim for 3392.0074 after the Gold Spot triggered a bullish formation on the 1 hour chart
Gold Spot has broken through a resistance line. It has touched this line at least twice in the…
A Channel Down has formed, Brent Crude is approaching support. Can we expect a breakout and the start of a new trend or a reversal?
Brent Crude is approaching the resistance line of a Channel Down. It has touched this line numerous times…