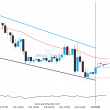
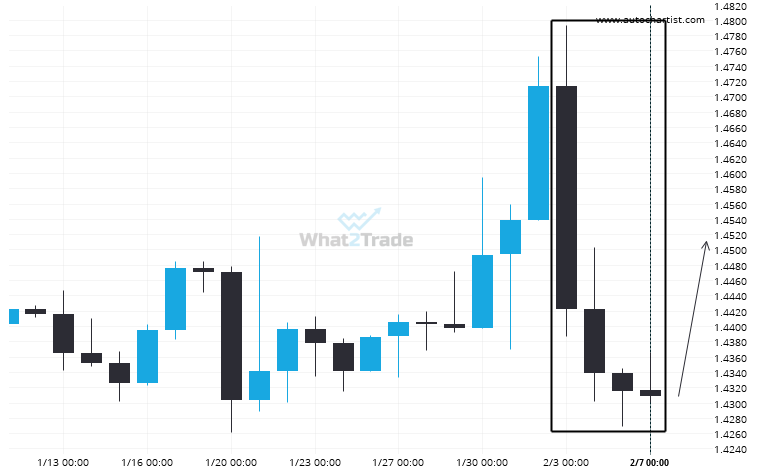
USDCAD has moved lower after 4 consecutive daily candles from 1.4713 to 1.4308 in the last 5 days.
Rare set of bearish consecutive candles on the USDCAD Daily chart. Can we expect a turn-around?

USDCAD has moved lower after 4 consecutive daily candles from 1.4713 to 1.4308 in the last 5 days.