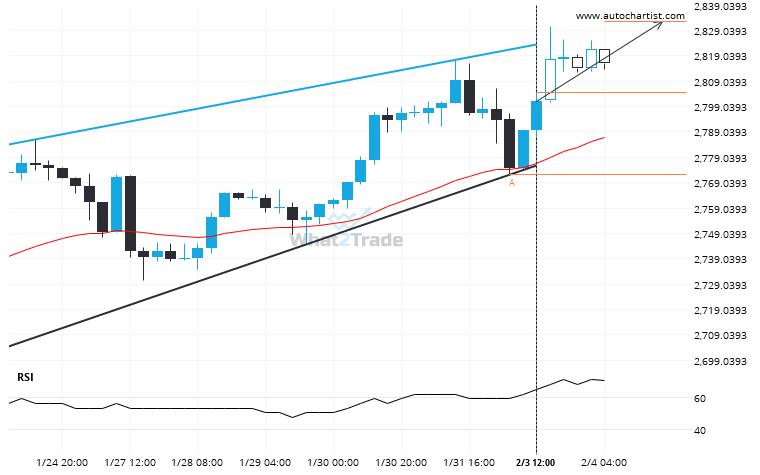
Emerging Rising Wedge pattern in its final wave was identified on the Gold Spot 4 hour chart. After a strong bullish run, we find Gold Spot heading towards the upper triangle line with a possible resistance at 2832.6282. If the resistance shows to hold, the Rising Wedge pattern suggests a rebound back towards current levels.
Related Posts
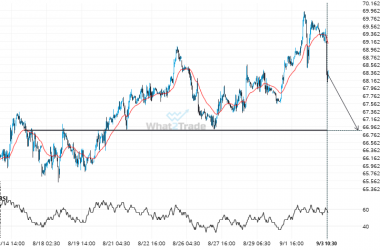
Supports and resistances are primary concepts of technical analysis. Brent Crude is heading for an important price of 66.8725 – read about what this could mean for the future.
Brent Crude is moving towards a support line. Because we have seen it retrace from this level in…
After testing the support line numerous times, Gold Spot is once again approaching this line. Can we expect a bearish trend to follow?
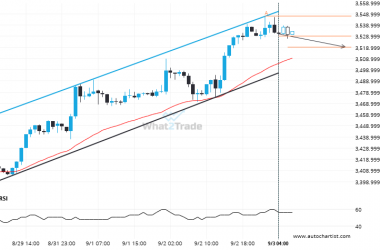
Gold Spot was identified at around 3529.325 having recently rebounded of the resistance on the 1 hour data…
A possible move on Brent Crude as it heads towards resistance
Emerging Channel Up pattern in its final wave was identified on the Brent Crude 1 hour chart. After…

