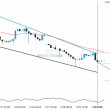
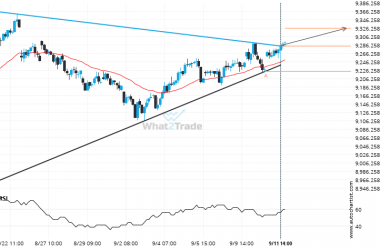
An unexpected large move has occurred on FTSE 100 Daily chart beginning at 8062.3 and ending at 8647.1. Is this a sign of something new? What can we expect in the future?
Related Posts
US 500 is approaching 6366.8701. We expect either a breakout through this line, or a rebound.
A strong support level has been identified at 6366.8701 on the 1 hour US 500 chart. US 500…
A possible move on DOW 30 as it heads towards support
DOW 30 is heading towards the support line of a Rising Wedge and could reach this point within…
Breach of 8655.5996 could mean a start of a bullish trend on ASX 200
ASX 200 has broken through a resistance line. Because we have seen it retrace from this price in…