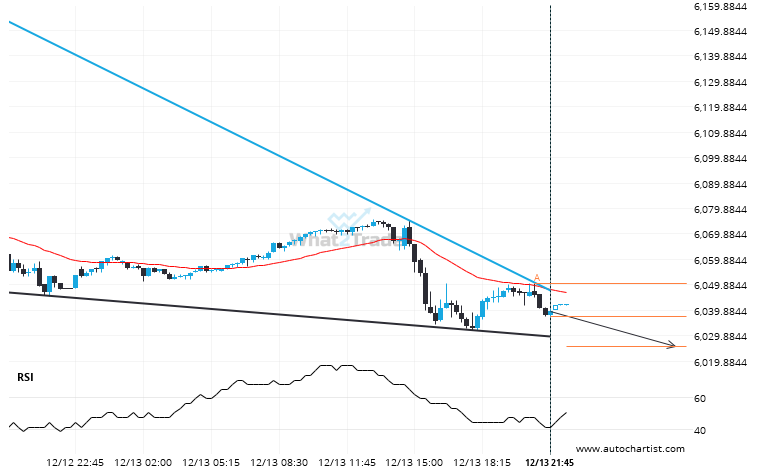
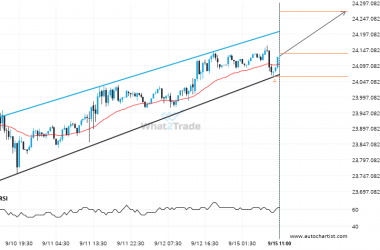
Emerging Falling Wedge detected on US 500 – the pattern is an emerging one and has not yet broken through resistance, but the price is expected to move up over the next few hours. The price at the time the pattern was found was 6037.57 and it is expected to move to 6025.5137.
Related Posts
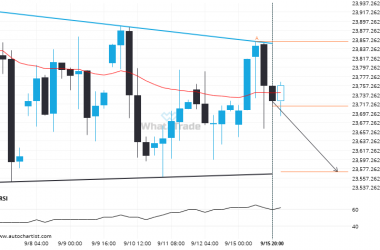
A Descending Triangle has formed, DAX 40 is approaching resistance. Can we expect a breakout and the start of a new trend or a reversal?
DAX 40 is moving towards a support line which it has tested numerous times in the past. We…
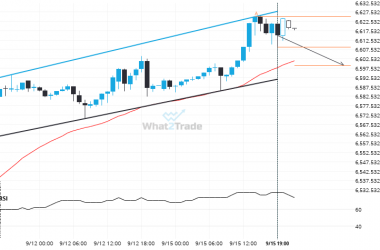
US 500 formed a Channel Up on the 1 hour chart. Retest of support in sight.
US 500 is trapped in a Channel Up formation, implying that a breakout is Imminent. This is a…
Because NAS 100 formed a Channel Up pattern, we expect it to touch the resistance line. If it breaks through resistance it may move much higher
NAS 100 is approaching the resistance line of a Channel Up. It has touched this line numerous times…

