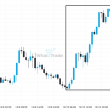
Rare set of consecutive candles on the DASHEUR Daily chart. Could we expect a turn around from 43.3800 or will this movement continue?
Related Posts
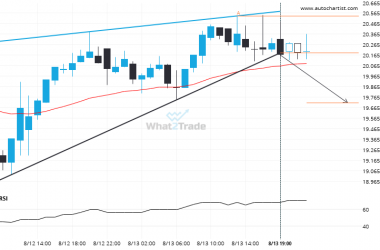
DASHEUR breakout from a Rising Wedge trade setup. Will it continue this trend to hit the target price?
DASHEUR has broken through the support line of a Rising Wedge technical chart pattern. Because we have seen…
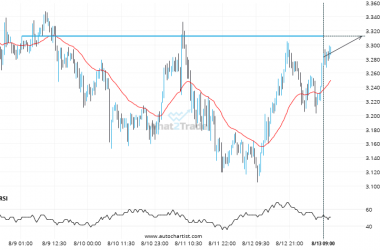
Supports and resistances are primary concepts of technical analysis. XRPUSD is heading for an important price of 3.3130 – read about what this could mean for the future.
XRPUSD is heading towards a line of 3.3130. If this movement continues, the price of XRPUSD could test…
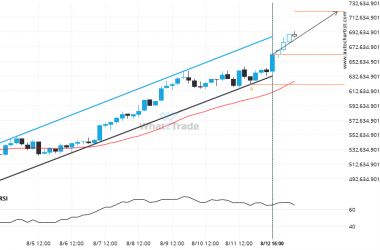
ETHJPY is approaching a resistance line of a Channel Up. It has touched this line numerous times in the last 10 days.
ETHJPY is heading towards the resistance line of a Channel Up. If this movement continues, the price of…

