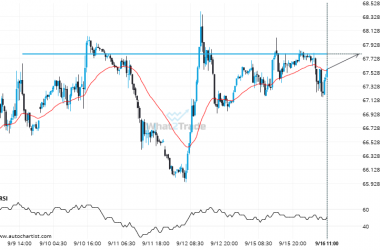
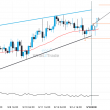
The last 16 4 hour candles on US Oil formed a Falling Wedge pattern and broken out through the pattern lines, indicating a possible bullish movement towards the price level of 71.0864.
Related Posts
Natural Gas seems to be on its way to resistance – a possible opportunity?
The price of Natural Gas in heading back to the resistance area. It is possible that it will…
Silver Spot – approaching a price line that has been previously tested numerous times in the past
Silver Spot is moving towards a key support level at 36.0185. This is a previously tested level for…
Gold Spot – approaching a support line that has been previously tested at least twice in the past
An emerging Channel Up has been detected on Gold Spot on the 1 hour chart. There is a…