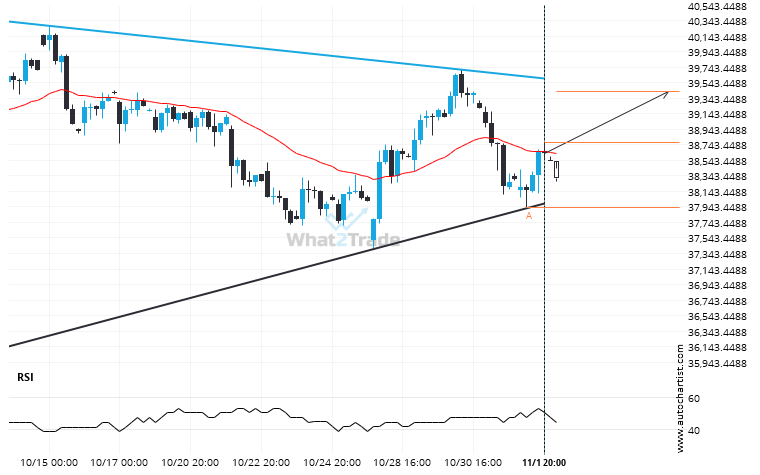
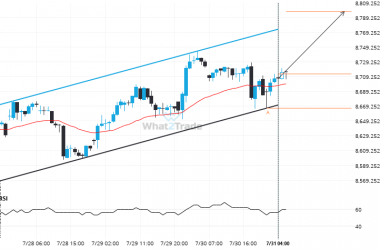
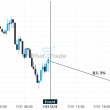
A Triangle pattern was identified on Nikkei 225 at 38767.0, creating an expectation that it may move to the resistance line at 39423.5000. It may break through that line and continue the bullish trend or it may reverse from that line.
Related Posts
CAC 40 – breach of a trending support line that has been tested at least twice before.
CAC 40 has broken through the support line which it has tested twice in the past. We have…
After experiencing a 9.6% bullish move in the space of 19 days, nobody knows where FTSE 100 is headed.
An unexpected large move has occurred on FTSE 100 Daily chart beginning at 7677.0 and ending at 8413.9.…
ASX 200 is signaling a possible trend reversal on the intraday charts with price not breaching resistance.
ASX 200 is moving towards a support line which it has tested numerous times in the past. We…