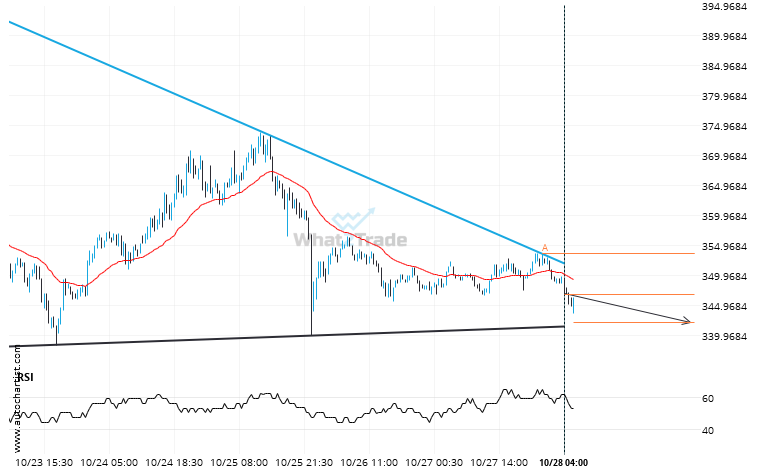
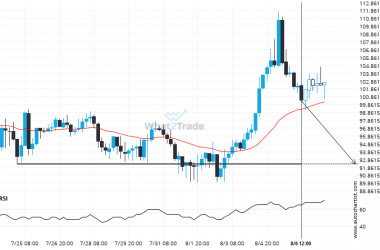
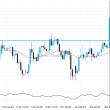
An emerging Descending Triangle has been detected on BCHUSD on the 30 Minutes chart. There is a possible move towards 342.1972 next few candles. Once reaching resistance it may continue its bearish run or reverse back to current price levels.
Related Posts
ETHJPY likely to test 358396.6563 in the near future. Where to next?
ETHJPY is en route to a very important line that will be a definite deciding factor of what…
XRPUSD – approaching a resistance line that has been previously tested at least twice in the past
XRPUSD is moving towards a resistance line which it has tested numerous times in the past. We have…
Could a large bearish move on BCHUSD be a sign of things to come?
BCHUSD has moved lower by 8.34% from 440.99 to 404.19 in the last 11 hours.