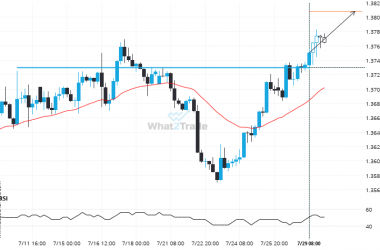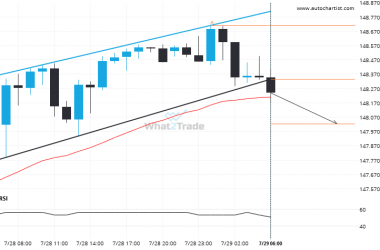
An unexpected large move has occurred on GBP/USD Daily chart beginning at 1.341 and ending at 1.30666. Is this a sign of something new? What can we expect in the future?
Is the extremely large movement on GBP/USD a sign of things to come?
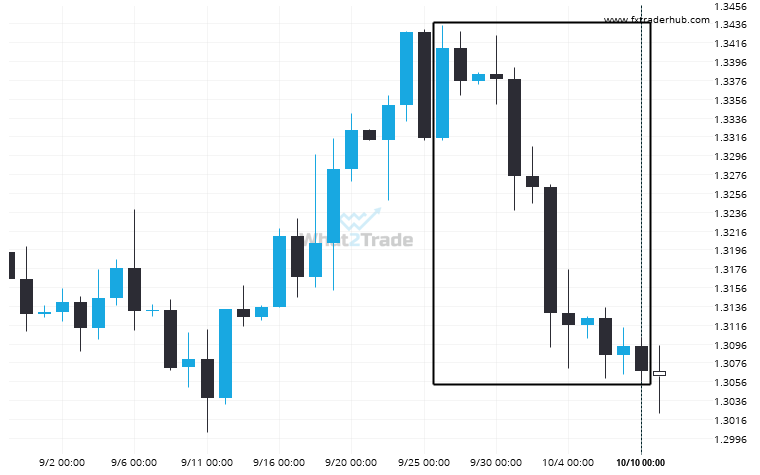

An unexpected large move has occurred on GBP/USD Daily chart beginning at 1.341 and ending at 1.30666. Is this a sign of something new? What can we expect in the future?