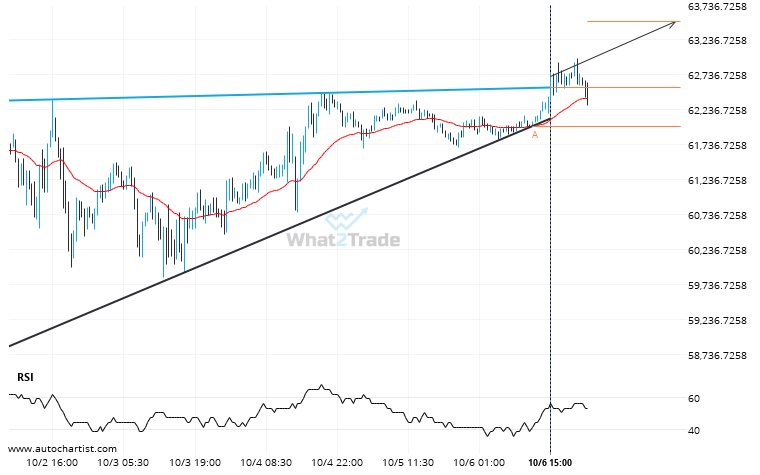
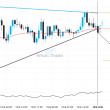
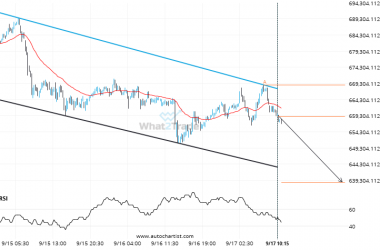
BTCUSD has broken through the resistance line of a Ascending Triangle technical chart pattern. Because we have seen it retrace from this line in the past, one should wait for confirmation of the breakout before taking any action. It has touched this line twice in the last 5 days and suggests a possible target level to be around 63504.0288 within the next 2 days.
Related Posts
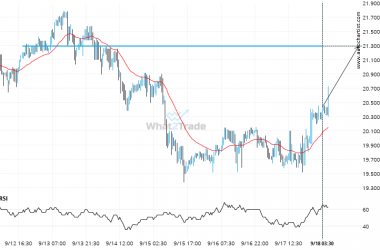
DASHEUR seems to be on its way to resistance – a possible opportunity?
DASHEUR is en route to a very important line that will be a definite deciding factor of what…
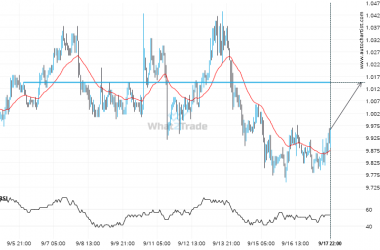
LTCBTC – approaching a price line that has been previously tested numerous times in the past
LTCBTC is heading towards a line of 1.0150E-03. If this movement continues, the price of LTCBTC could test…
A possible move on ETHJPY as it heads towards support
An emerging Channel Down has been detected on ETHJPY on the 15 Minutes chart. There is a possible…

