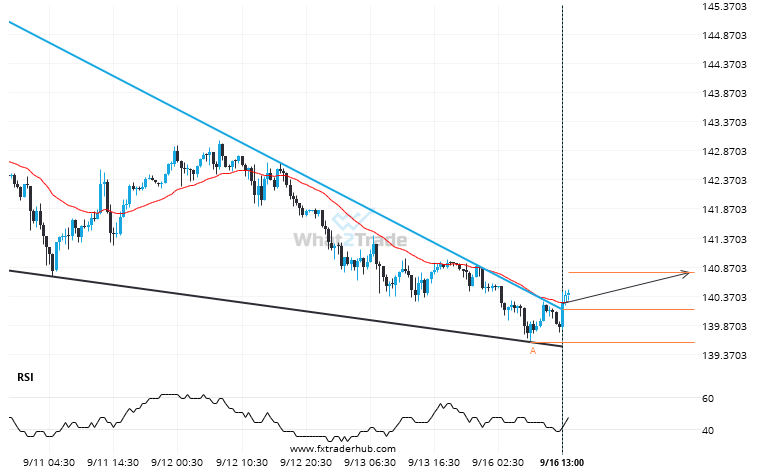
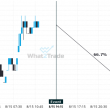
USD/JPY moved through the resistance line of a Falling Wedge at 140.13712698412698 on the 30 Minutes chart. This line has been tested a number of times in the past and this breakout could mean an upcoming change from the current trend. It may continue in its current direction toward 140.7848.
Related Posts
EURAUD is approaching a support line of a Triangle. It has touched this line numerous times in the last 4 days.
EURAUD is moving towards a support line. Because we have seen it retrace from this line before, we…
Supports and resistances are primary concepts of technical analysis. GBPCHF is heading for an important price of 1.1138 – read about what this could mean for the future.
GBPCHF is moving towards a resistance line. Because we have seen it retrace from this level in the…
EURUSD moves higher to 1.1609 in the last 6 days.
Due to the rate of consecutive bullish candles on EURUSD Daily chart we could be in for a…