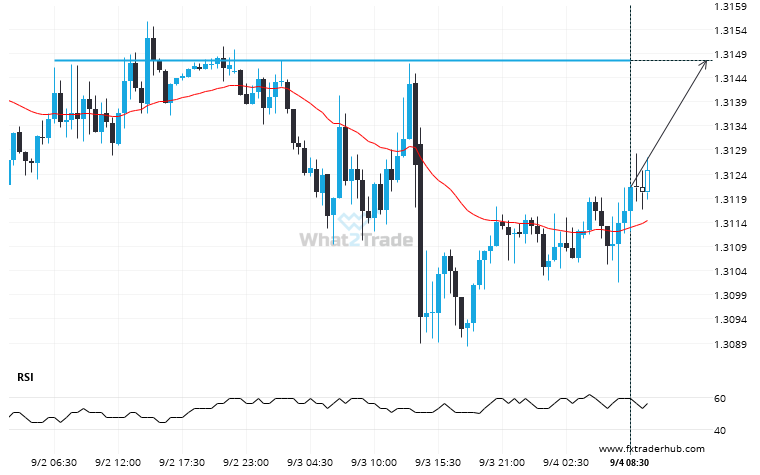
GBP/USD is about to retest a key horizontal resistance level near 1.3147. It has tested this level 5 times in the recent past and could simply bounce off like it did last time. However, after this many tries, maybe it’s ready to start a new trend.
Related Posts
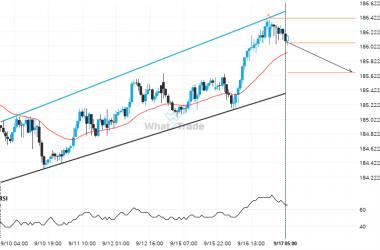
EURJPY is approaching a resistance line of a Channel Up. It has touched this line numerous times in the last 8 days.
Emerging Channel Up pattern in its final wave was identified on the EURJPY 1 hour chart. After a…
After testing 0.6651 numerous times, AUDUSD is once again approaching this price point. Can we expect a bearish trend to follow?
AUDUSD is heading towards 0.6651 and could reach this point within the next 19 hours. It has tested…
A possible move on CHFJPY as it heads towards support
CHFJPY is moving towards a support line. Because we have seen it retrace from this line before, we…

