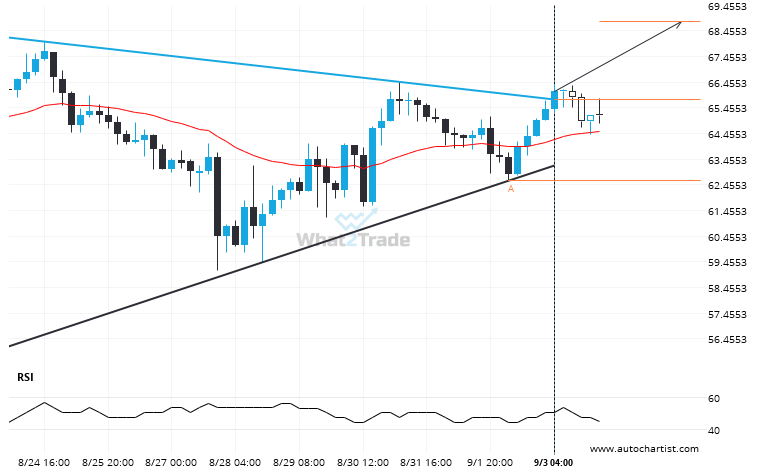
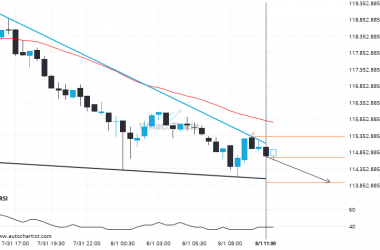
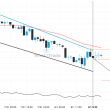
LTCUSD has broken through a resistance line. It has touched this line at least twice in the last 13 days. This breakout may indicate a potential move to 68.8213 within the next 3 days. Because we have seen it retrace from this position in the past, one should wait for confirmation of the breakout before trading.
Related Posts
BTCUSD – breach of price line that’s been previously tested numerous times before
BTCUSD has broken through a line of 59738.6016. If this breakout holds true, we could see the price…
After trying numerous times in the past, BCHUSD finally breaks 311.3000!
BCHUSD is once again retesting a key horizontal support level at 311.3000. It has tested this level 3…
After testing 64.4800 numerous times, LTCUSD is once again approaching this price point. Can we expect a bullish trend to follow?
LTCUSD is about to retest a key horizontal resistance level near 64.4800. It has tested this level 3…