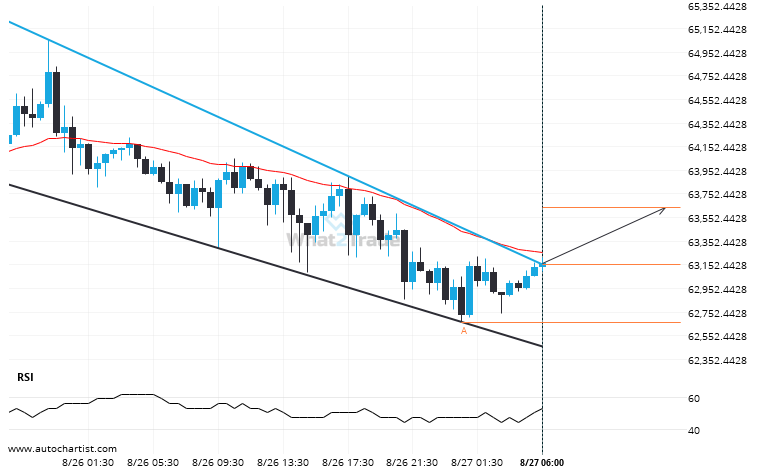
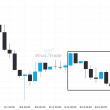
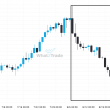
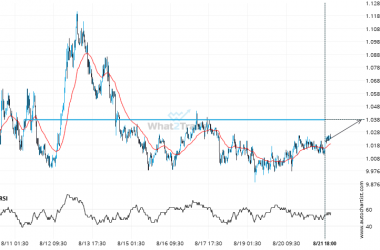
BTCUSD moved through the resistance line of a Channel Down at 63155.278648648644 on the 30 Minutes chart. This line has been tested a number of times in the past and this breakout could mean an upcoming change from the current trend. It may continue in its current direction toward 63642.2559.
Related Posts
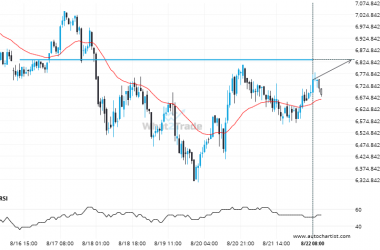
A final push possible on ETHAUD as it starts approaching a price line of 6832.7202.
The movement of ETHAUD towards 6832.7202 price line is yet another test of the line it reached numerous…
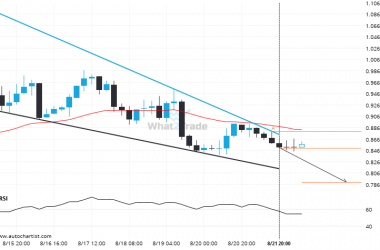
ADAUSD is quickly approaching the support line of a Falling Wedge. We expect either a breakout through this line or a rebound.
ADAUSD was identified at around 0.8502 having recently rebounded of the resistance on the 4 hour data interval.…
Will LTCBTC break through the resistance level it tested before?
LTCBTC is moving towards a line of 1.0370E-03 which it has tested numerous times in the past. We…

