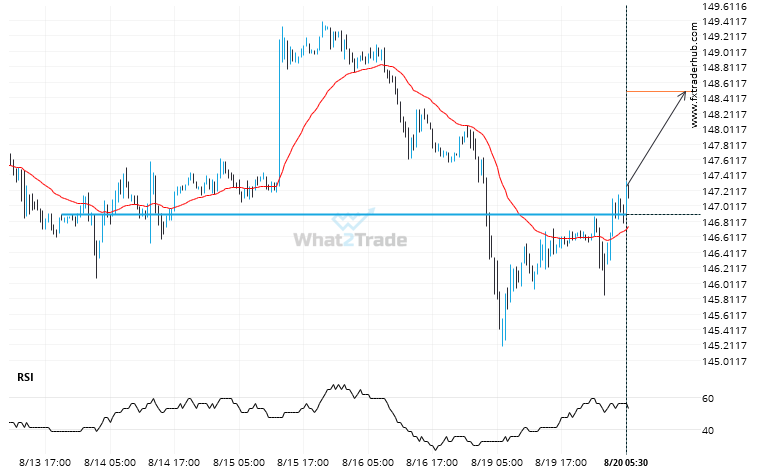
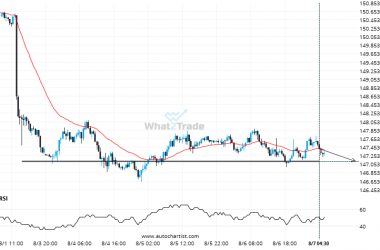
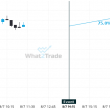
USD/JPY has broken through 146.9020 which it has tested numerous times in the past. We have seen it retrace from this price in the past. If this new trend persists, USD/JPY may be heading towards 148.4903 within the next 2 days.
Related Posts
Breach of support could mean a start of a bearish trend on EURGBP
EURGBP moved through the support line of a Triangle at 0.851723043478261 on the 4 hour chart. This line…
Rare set of bearish consecutive candles on the AUDCAD Daily chart. Can we expect a turn-around?
AUDCAD has moved lower after 5 consecutive daily candles from 0.8928 to 0.8811 in the last 5 days.
EURAUD is approaching a support line of a Triangle. It has touched this line numerous times in the last 4 days.
EURAUD is moving towards a support line. Because we have seen it retrace from this line before, we…