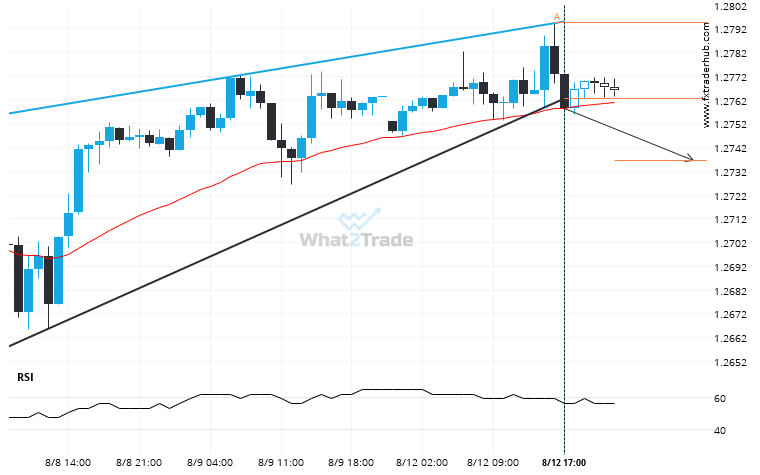
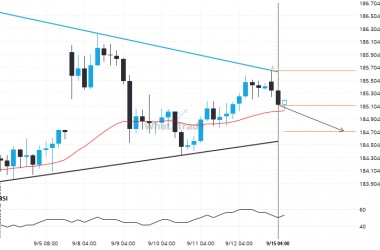
GBP/USD has broken through a support line of a Rising Wedge chart pattern. If this breakout holds true, we may see the price of GBP/USD testing 1.2736 within the next 11 hours. But don’t be so quick to trade, it has tested this line in the past, so you should confirm the breakout before taking any action.
Related Posts
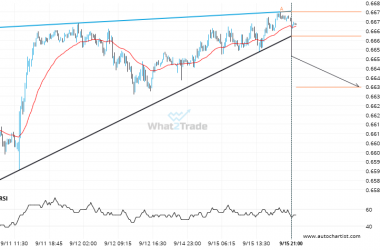
Interesting opportunity on AUDUSD after breaking 0.6661789552238805
This trade setup on AUDUSD is formed by a period of consolidation; a period in which the price…
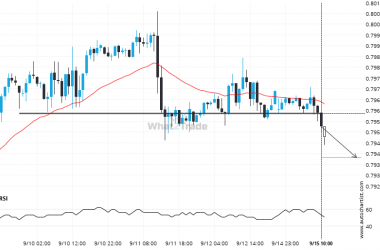
After testing 0.7961 numerous times, USDCHF has finally broken through. Can we expect a bearish trend to follow?
USDCHF has broken through a support line. It has touched this line numerous times in the last 6…
Because CHFJPY formed a Triangle pattern, we expect it to touch the support line. If it breaks through support it may move much lower
CHFJPY is heading towards the support line of a Triangle and could reach this point within the next…

