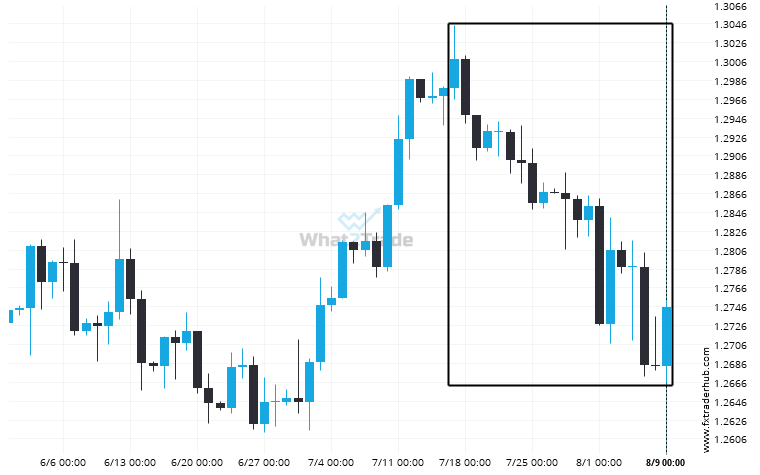
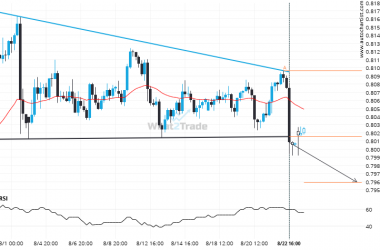
GBP/USD dropped sharply for 23 days – which is an excessively big movement for this instrument; exceeding the 98% of past price moves. Even if this move is a sign of a new trend in GBP/USD there is a chance that we will witness a correction, no matter how brief.
Related Posts
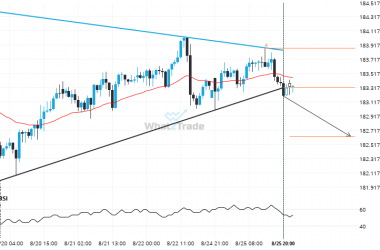
After testing support twice in the past, CHFJPY has finally broken through. Can we expect a bearish trend to follow?
Triangle pattern identified on CHFJPY has broken through a support level with the price momentum continuing to move…
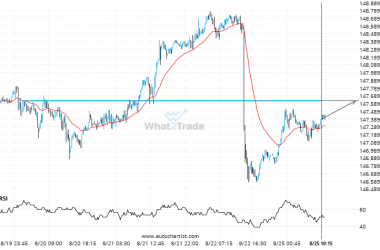
After testing 147.6275 numerous times, USDJPY is once again approaching this price point. Can we expect a bullish trend to follow?
USDJPY is about to retest a key horizontal resistance level near 147.6275. It has tested this level 8…
USDCHF has broken through support of a Descending Triangle. It has touched this line at least twice in the last 30 days.
You would be well advised to confirm the breakout that has just occurred – do you believe the…

