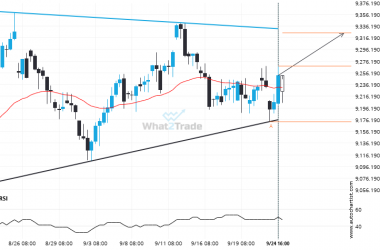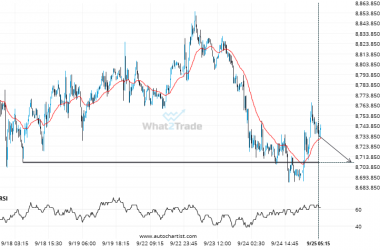
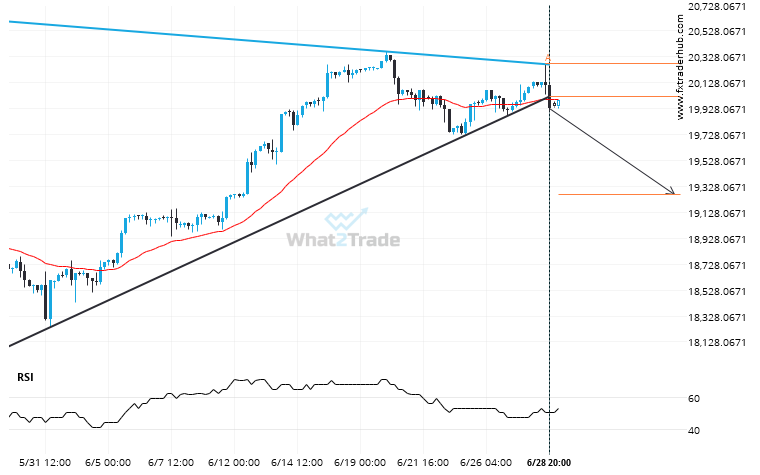
The last 36 4 hour candles on NAS100 formed a Triangle pattern and broken out through the pattern lines, indicating a possible bearish movement towards the price level of 19269.7413.
Interesting opportunity on NAS100 after breaking 20024.06651376147

The last 36 4 hour candles on NAS100 formed a Triangle pattern and broken out through the pattern lines, indicating a possible bearish movement towards the price level of 19269.7413.