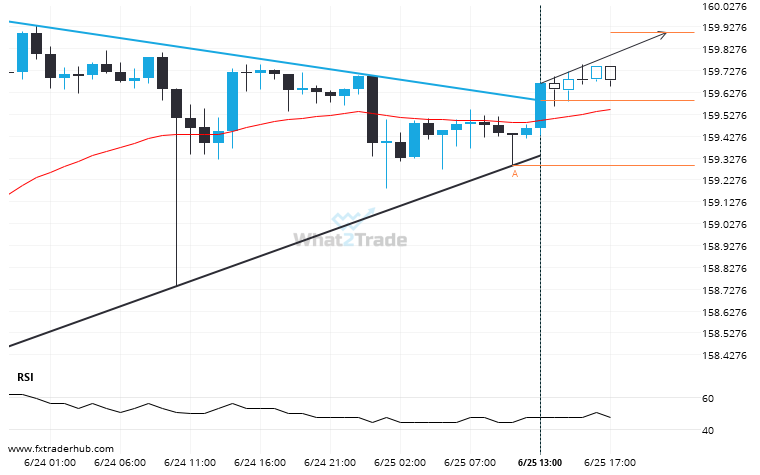
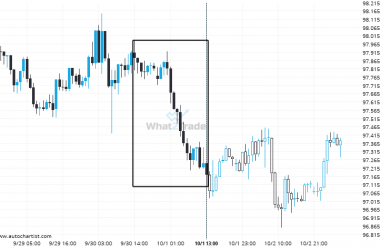
USD/JPY has broken through the resistance line of a Triangle technical chart pattern. Because we have seen it retrace from this line in the past, one should wait for confirmation of the breakout before taking any action. It has touched this line twice in the last 5 days and suggests a possible target level to be around 159.9019 within the next 6 hours.
USD/JPY broke through a resistance at 2024-06-25T14:00:00.000Z, with the price momentum continuing to move in an upward direction over the next hours, good opportunity presents itself with the price expected to reach 159.9019.