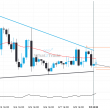
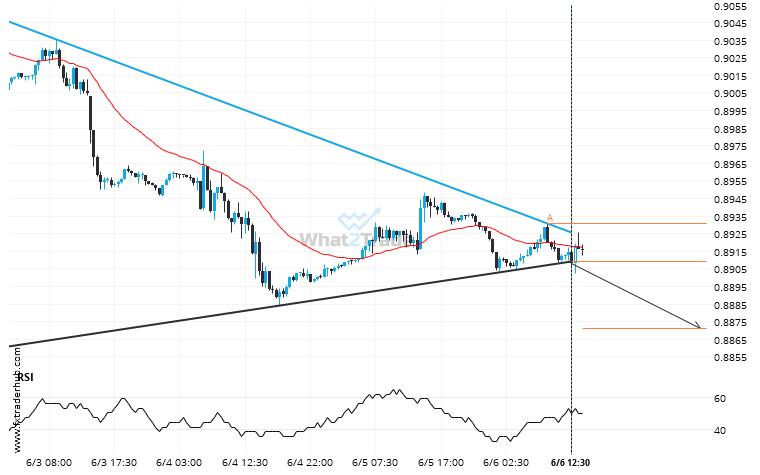
USD/CHF moved through the support line of a Triangle at 0.8909753623188404 on the 30 Minutes chart. This line has been tested a number of times in the past and this breakout could mean an upcoming change from the current trend. It may continue in its current direction toward 0.8872.
Related Posts
AUDNZD moves higher to 1.11437 in the last 2 days.
Those of you that are trend followers are probably eagerly watching AUDNZD to see if its latest 0.8%…
After trying numerous times in the past, CHFJPY finally breaks 174.3430!
The price of CHFJPY in heading in the direction of 173.4600. Despite the recent breakout through 174.3430 it…
A Falling Wedge has formed, AUDCAD is approaching resistance. Can we expect a breakout and the start of a new trend or a reversal?
An emerging Falling Wedge has been detected on AUDCAD on the 4 hour chart. There is a possible…