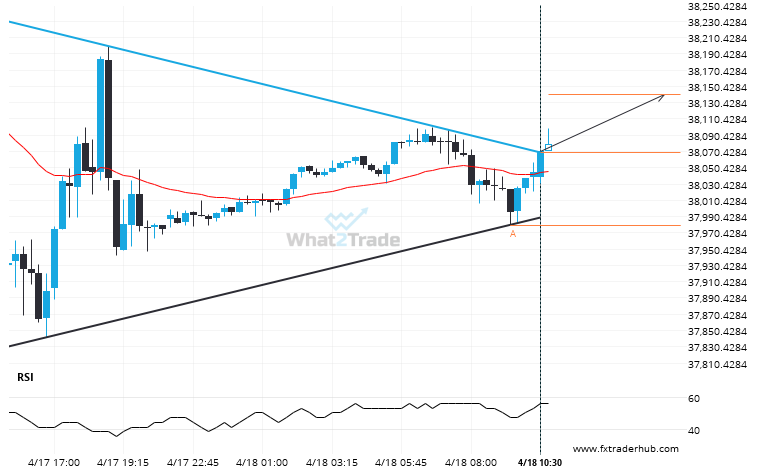
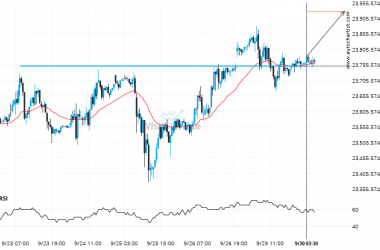
US30 moved through the resistance line of a Triangle at 38068.90909090909 on the 15 Minutes chart. This line has been tested a number of times in the past and this breakout could mean an upcoming change from the current trend. It may continue in its current direction toward 38140.1452.
Related Posts
After testing resistance twice in the past, DOW 30 has finally broken through. Can we expect a bullish trend to follow?
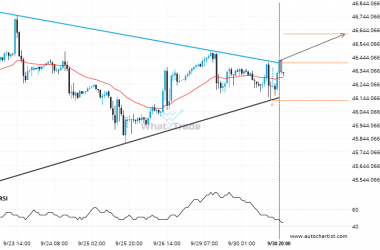
DOW 30 has broken through a resistance line of a Triangle and suggests a possible movement to 46612.9534…
Extreme movement experienced on DAX 40. Check the chart to see what to do next.
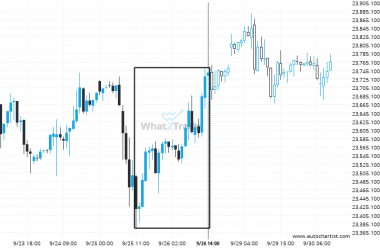
DAX 40 just posted a 1.37% move over the past 2 days – a move that won’t go…
After testing 23751.1992 numerous times, DAX 40 has finally broken through. Can we expect a bullish trend to follow?
DAX 40 has broken through a resistance line. Because we have seen it retrace from this price in…

