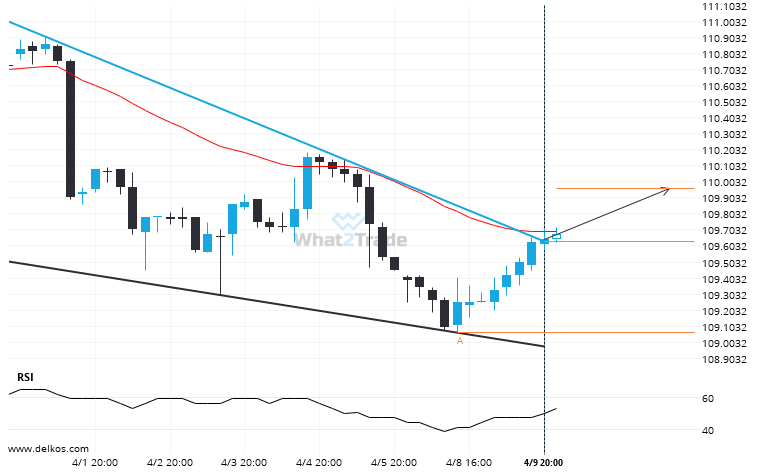
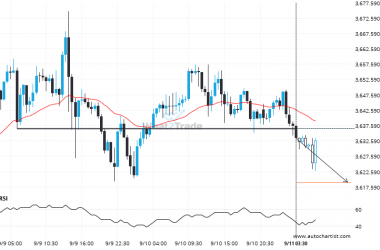
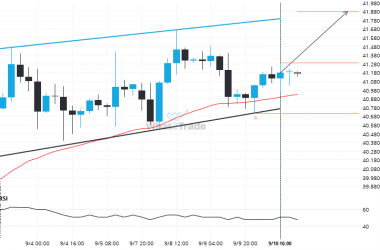
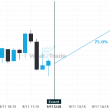
10 Yr Us Treasury Note June 2024 moved through the resistance line of a Falling Wedge at 109.63020833333333 on the 4 hour chart. This line has been tested a number of times in the past and this breakout could mean an upcoming change from the current trend. It may continue in its current direction toward 109.9628.
Related Posts
Gold Spot through 3366.28135. Is this a confirming a breakout? Will it continue its path in the current trend toward 3306.1199?
Gold Spot has broken through a support line of a Rising Wedge and suggests a possible movement to…
A final push possible on Natural Gas as it starts approaching a price line of 3.3975.
Natural Gas is en route to a very important line that will be a definite deciding factor of…
Natural Gas through 3.425869565217391. Is this a confirming a breakout? Will it continue its path in the current trend toward 3.3833?
Natural Gas has broken through a support line of a Triangle chart pattern. If this breakout holds true,…