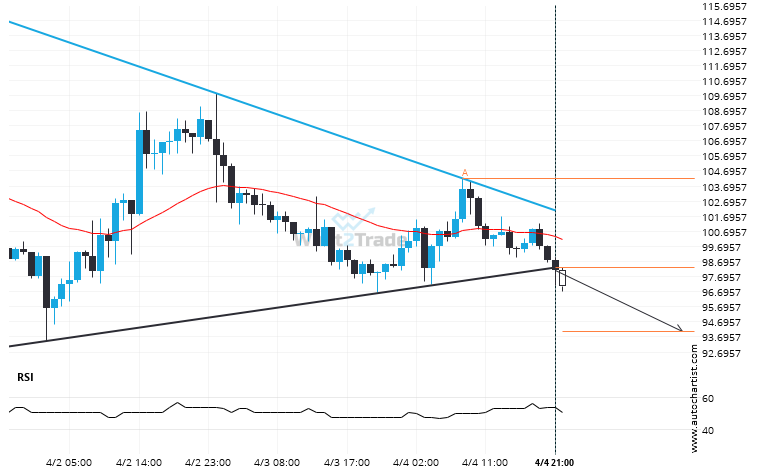
LTCUSD moved through the support line of a Triangle at 98.33162790697675 on the 1 hour chart. This line has been tested a number of times in the past and this breakout could mean an upcoming change from the current trend. It may continue in its current direction toward 94.0490.
Related Posts
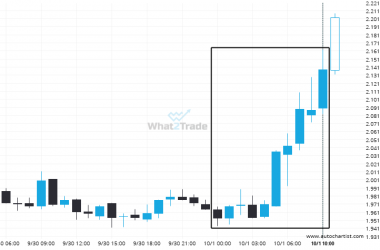
DASHBTC – Large moves like this tend to draw attention.
DASHBTC reached 0.0002138 after a 9.47% move spanning 10 hours.
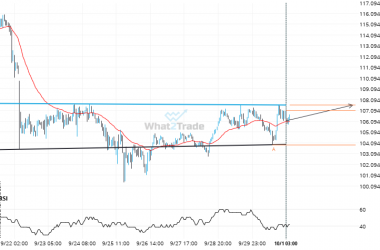
LTCUSD is approaching a resistance line of a Inverse Head and Shoulders. It has touched this line numerous times in the last 10 days.
LTCUSD is heading towards the resistance line of a Inverse Head and Shoulders and could reach this point…
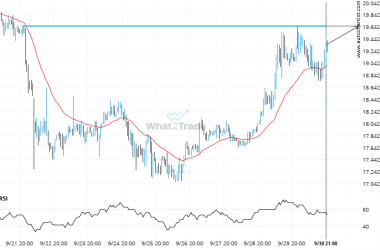
Will DASHEUR break through the resistance level it tested before?
DASHEUR is moving towards a line of 19.6500 which it has tested numerous times in the past. We…

