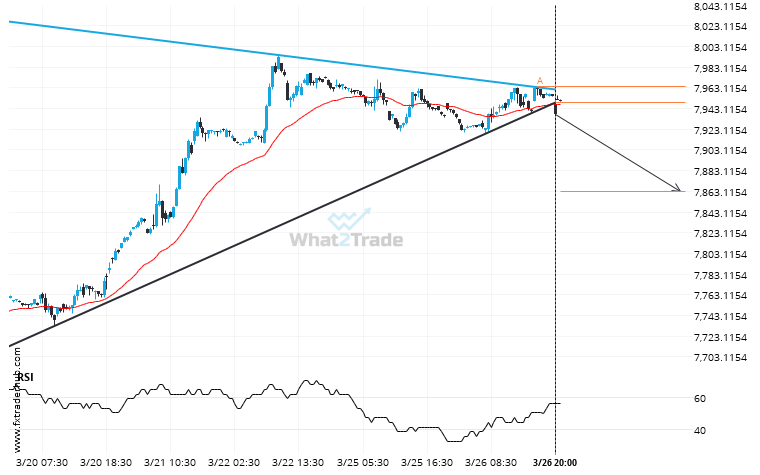
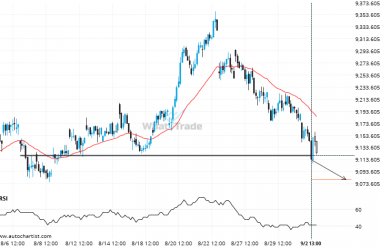
UK100 has broken through a support line of a Triangle chart pattern. If this breakout holds true, we may see the price of UK100 testing 7862.9864 within the next 23 hours. But don’t be so quick to trade, it has tested this line in the past, so you should confirm the breakout before taking any action.
Related Posts
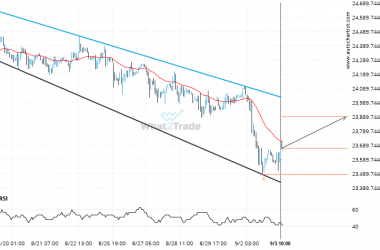
DAX 40 – approaching a resistance line that has been previously tested at least twice in the past
DAX 40 is moving towards a resistance line. Because we have seen it retrace from this line before,…
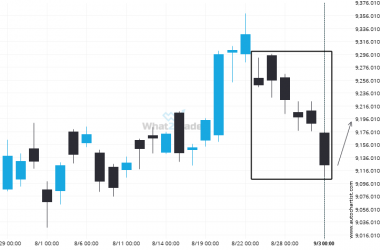
FTSE 100 posted 6 consecutive bearish Daily candles.
Rare candle sequence recorded on the FTSE 100 Daily chart, ending at 9123.4500.
After testing 9120.0000 numerous times, FTSE 100 has finally broken through. Can we expect a bearish trend to follow?
FTSE 100 has broken through a line of 9120.0000 and suggests a possible movement to 9079.4912 within the…

