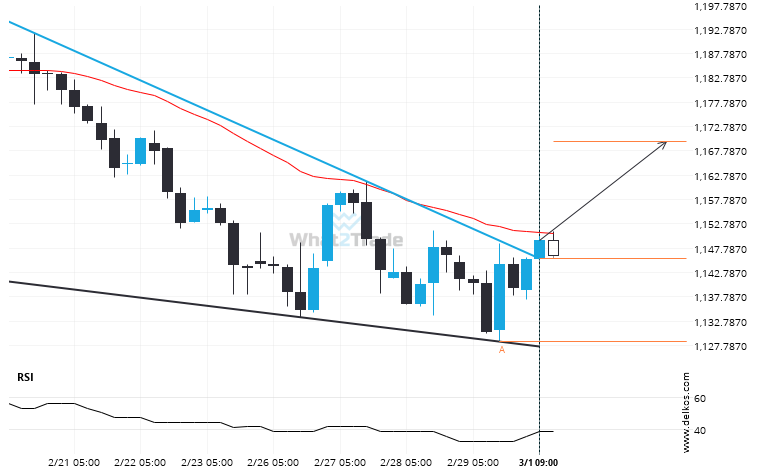
Soybeans May 2024 moved through the resistance line of a Falling Wedge at 1145.6399999999999 on the 4 hour chart. This line has been tested a number of times in the past and this breakout could mean an upcoming change from the current trend. It may continue in its current direction toward 1169.6664.
Related Posts
Bulls aim for 40.3959 after the Silver Spot triggered a bearish formation on the 4 hour chart
This trade setup on Silver Spot is formed by a period of consolidation; a period in which the…
US Oil keeps moving closer towards 62.1225. Will it finally breach this level?
The price of US Oil in heading back to the support area. It is possible that it will…
Brent Crude has broken through resistance of a Triangle. It has touched this line at least twice in the last 9 days.
Brent Crude has broken through a resistance line of a Triangle and suggests a possible movement to 67.5112…


