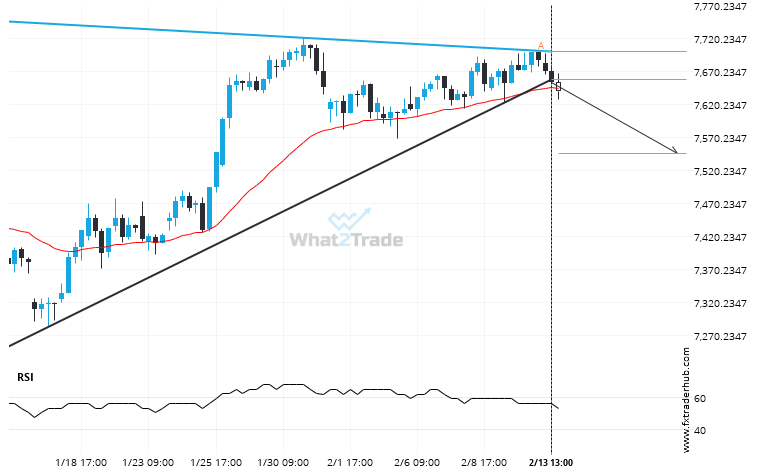
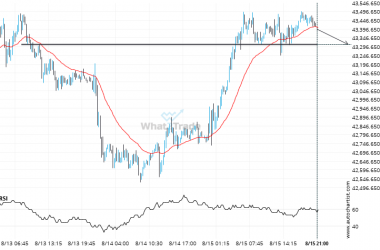
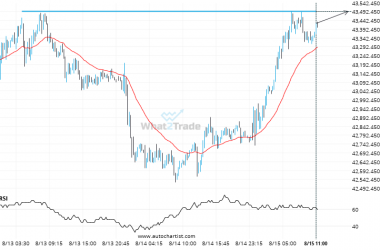
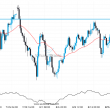
FRA40 has broken through the support line of a Triangle technical chart pattern. Because we have seen it retrace from this line in the past, one should wait for confirmation of the breakout before taking any action. It has touched this line twice in the last 34 days and suggests a possible target level to be around 7546.3687 within the next 4 days.
Related Posts
US 500 keeps moving closer towards 5896.3398. Will it finally breach this level?
US 500 is moving towards a support line. Because we have seen it retrace from this level in…
US 500 – approaching a resistance line that has been previously tested at least twice in the past
US 500 is moving towards a resistance line which it has tested numerous times in the past. We…
After experiencing a 15.53% bullish move in the space of 66 days, nobody knows where FTSE 100 is headed.
FTSE 100 experienced an extremely large move that lasted 66. This movement is in the 98.0 percentile and…