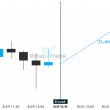
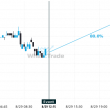
An unexpected large move has occurred on USD/CAD 1 hour chart beginning at 1.34593 and ending at 1.33778. Is this a sign of something new? What can we expect in the future?
USD/CAD hits 1.33778 after a 0.61% move spanning 18 hours


An unexpected large move has occurred on USD/CAD 1 hour chart beginning at 1.34593 and ending at 1.33778. Is this a sign of something new? What can we expect in the future?