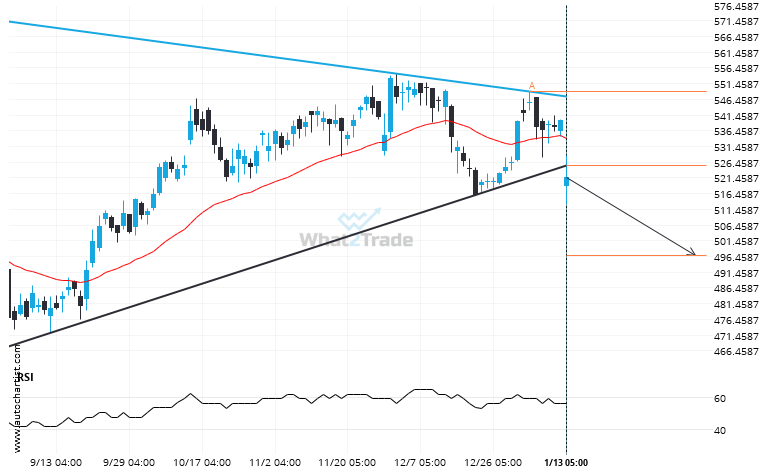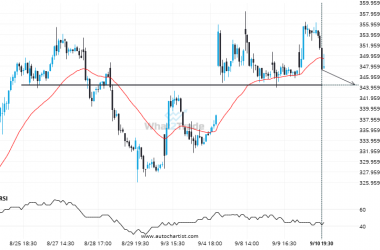
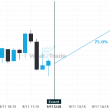
UnitedHealth Group Incorporated moved through the support line of a Triangle at 525.245 on the Daily chart. This line has been tested a number of times in the past and this breakout could mean an upcoming change from the current trend. It may continue in its current direction toward 496.88.
UnitedHealth Group Incorporated has broken through support of a Triangle. It has touched this line at least twice in the last 179 days.